nehaloNehalo
Log inOpen the map

A living chart for everyone on the water.

Made for every way you explore, play and travel.

Invite-only for now, open to everyone soon. Leave your email address and we'll send you an invitation as soon as there is room.

Thank you.

We'll email you as soon as there is room.
Open the map
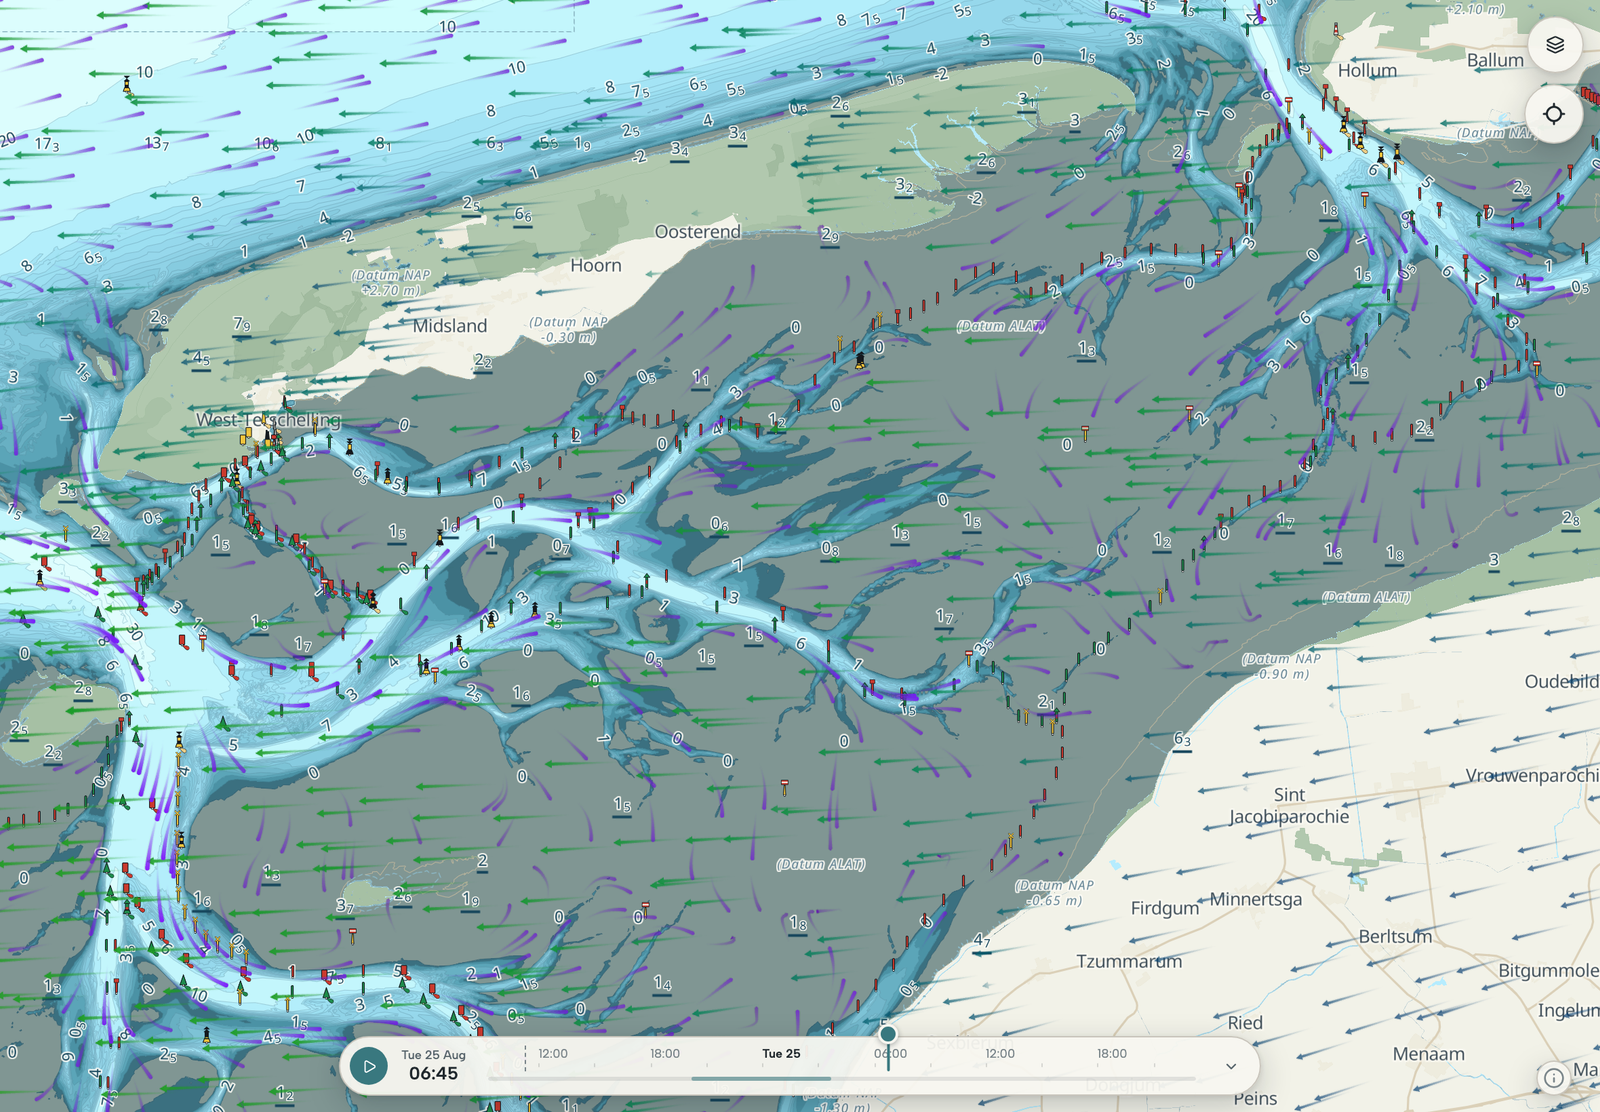
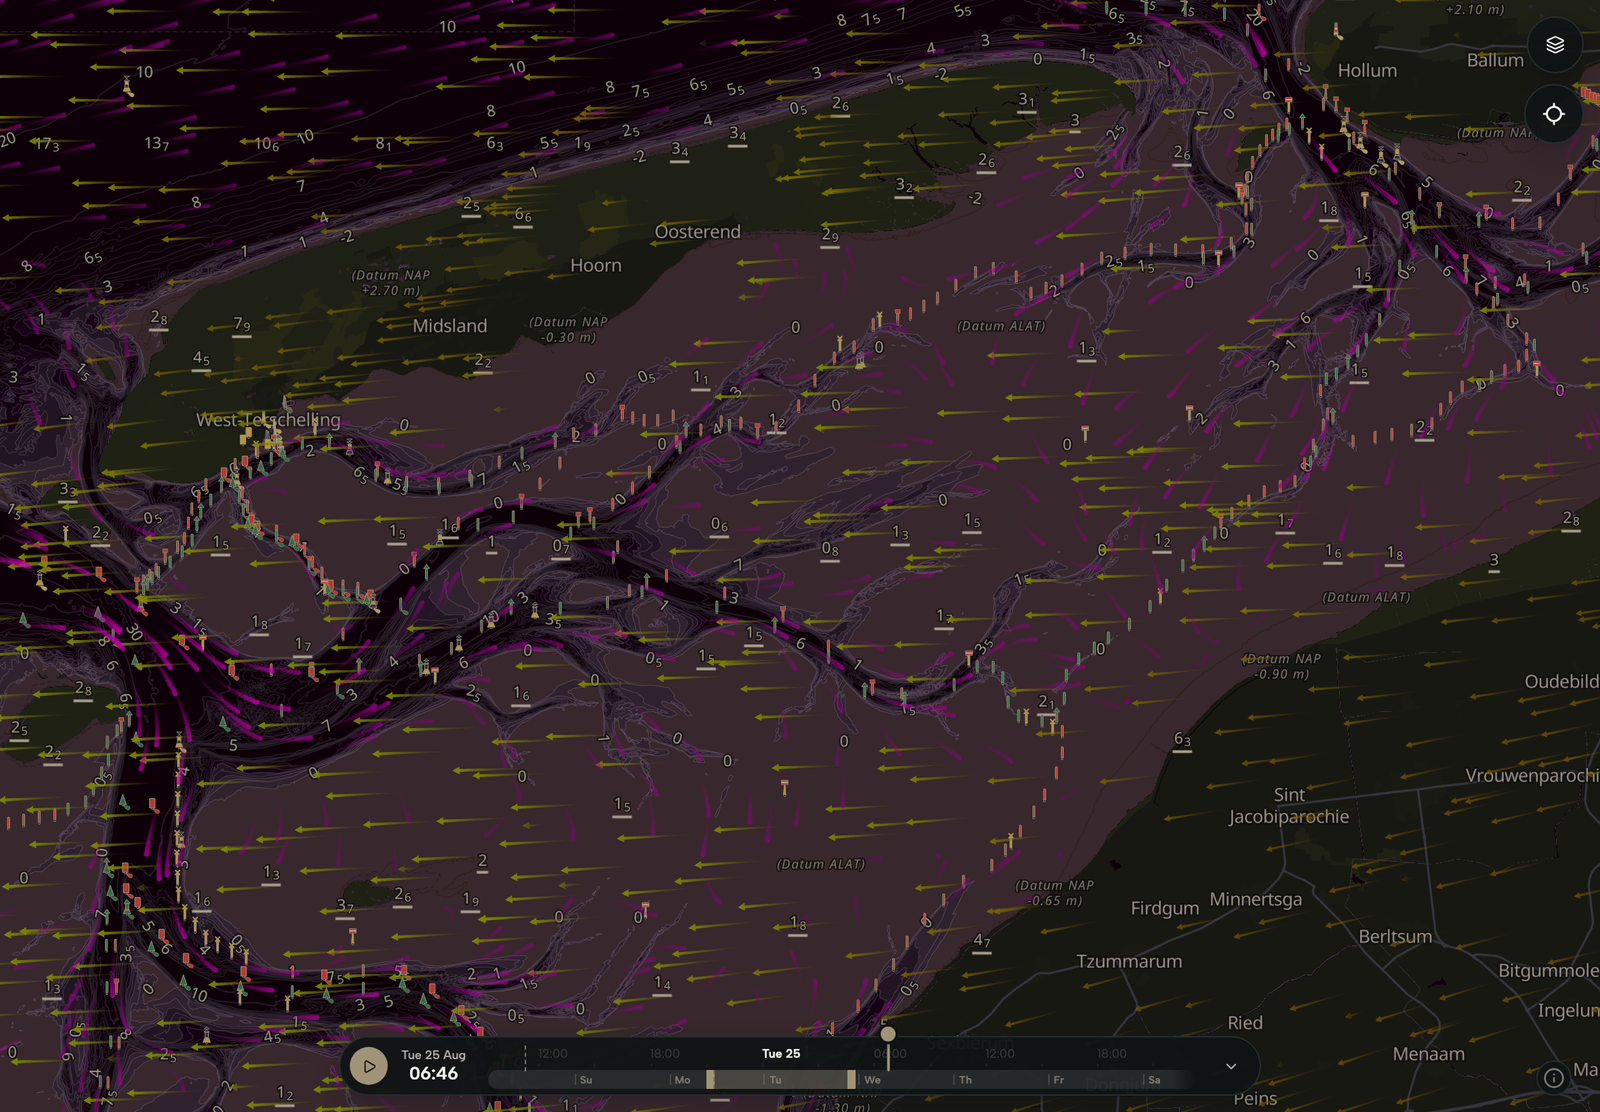
Tablet showing the Wadden Sea chart between Terschelling and the Frisian coast, with the timeline set to tomorrow and wind and current across the map.Tablet showing the Wadden Sea chart between Terschelling and the Frisian coast, with the timeline set to tomorrow and wind and current across the map.Tablet showing the Wadden Sea chart between Terschelling and the Frisian coast, with the timeline set to tomorrow and wind and current across the map.
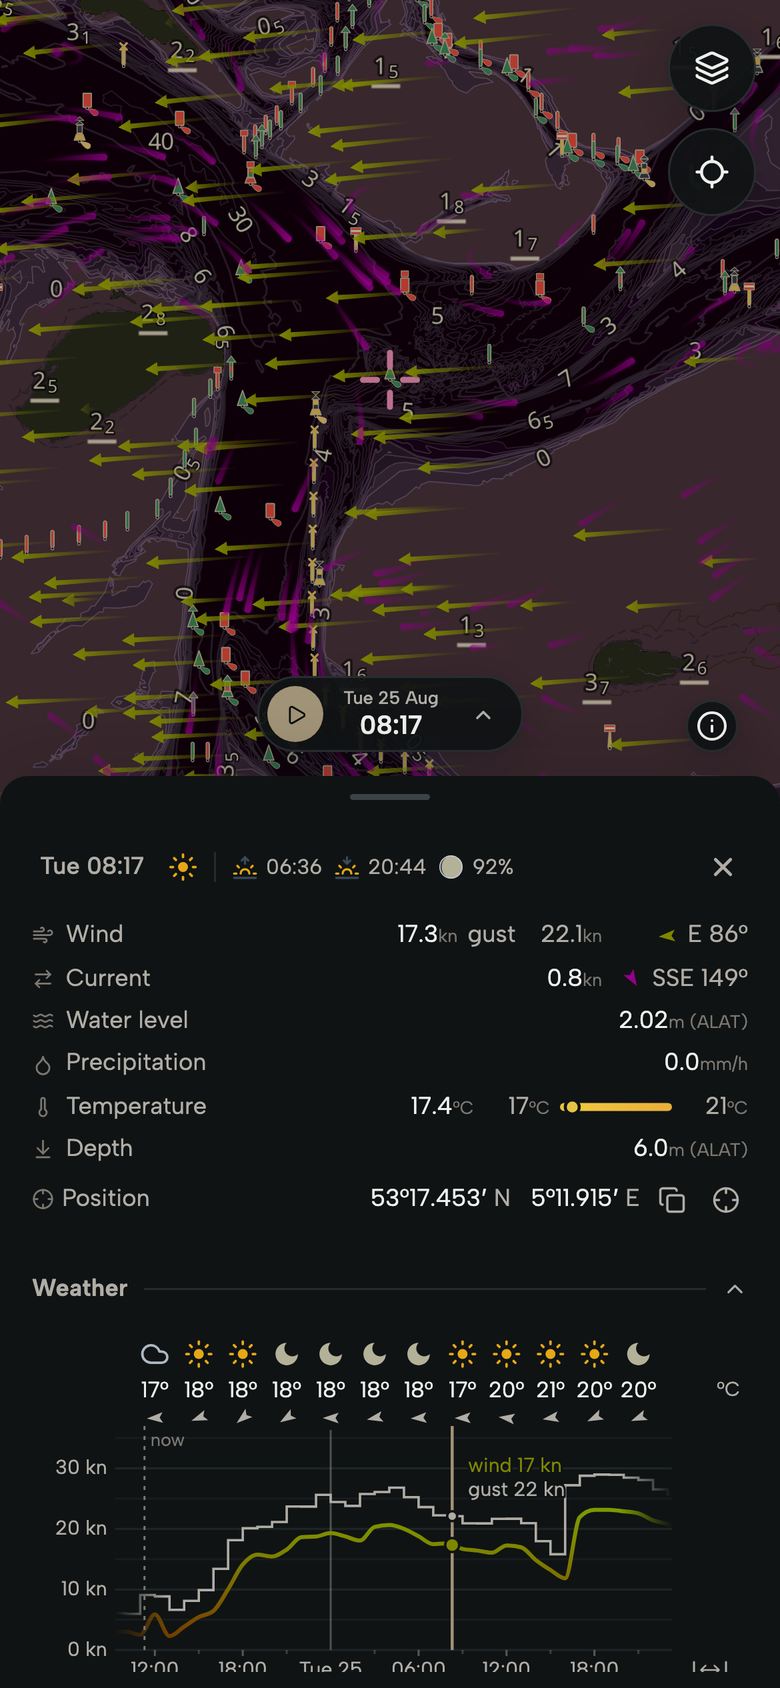
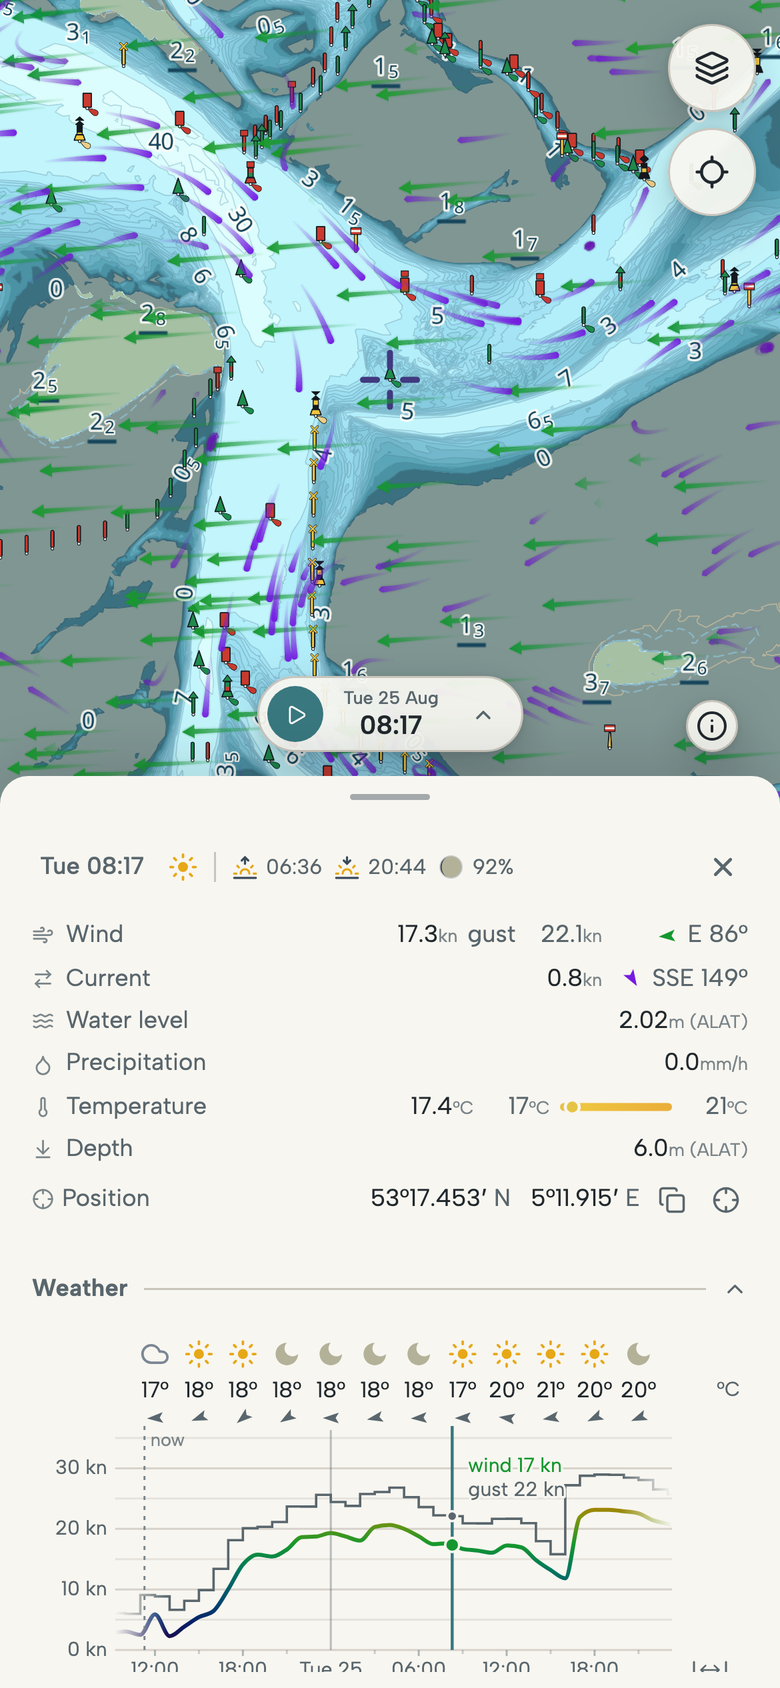
Phone showing a selected point in the Vlie, between Vlieland and Terschelling, with wind, current, water level, temperature, depth and the forecast for the coming hours.Phone showing a selected point in the Vlie, between Vlieland and Terschelling, with wind, current, water level, temperature, depth and the forecast for the coming hours.Phone showing a selected point in the Vlie, between Vlieland and Terschelling, with wind, current, water level, temperature, depth and the forecast for the coming hours.

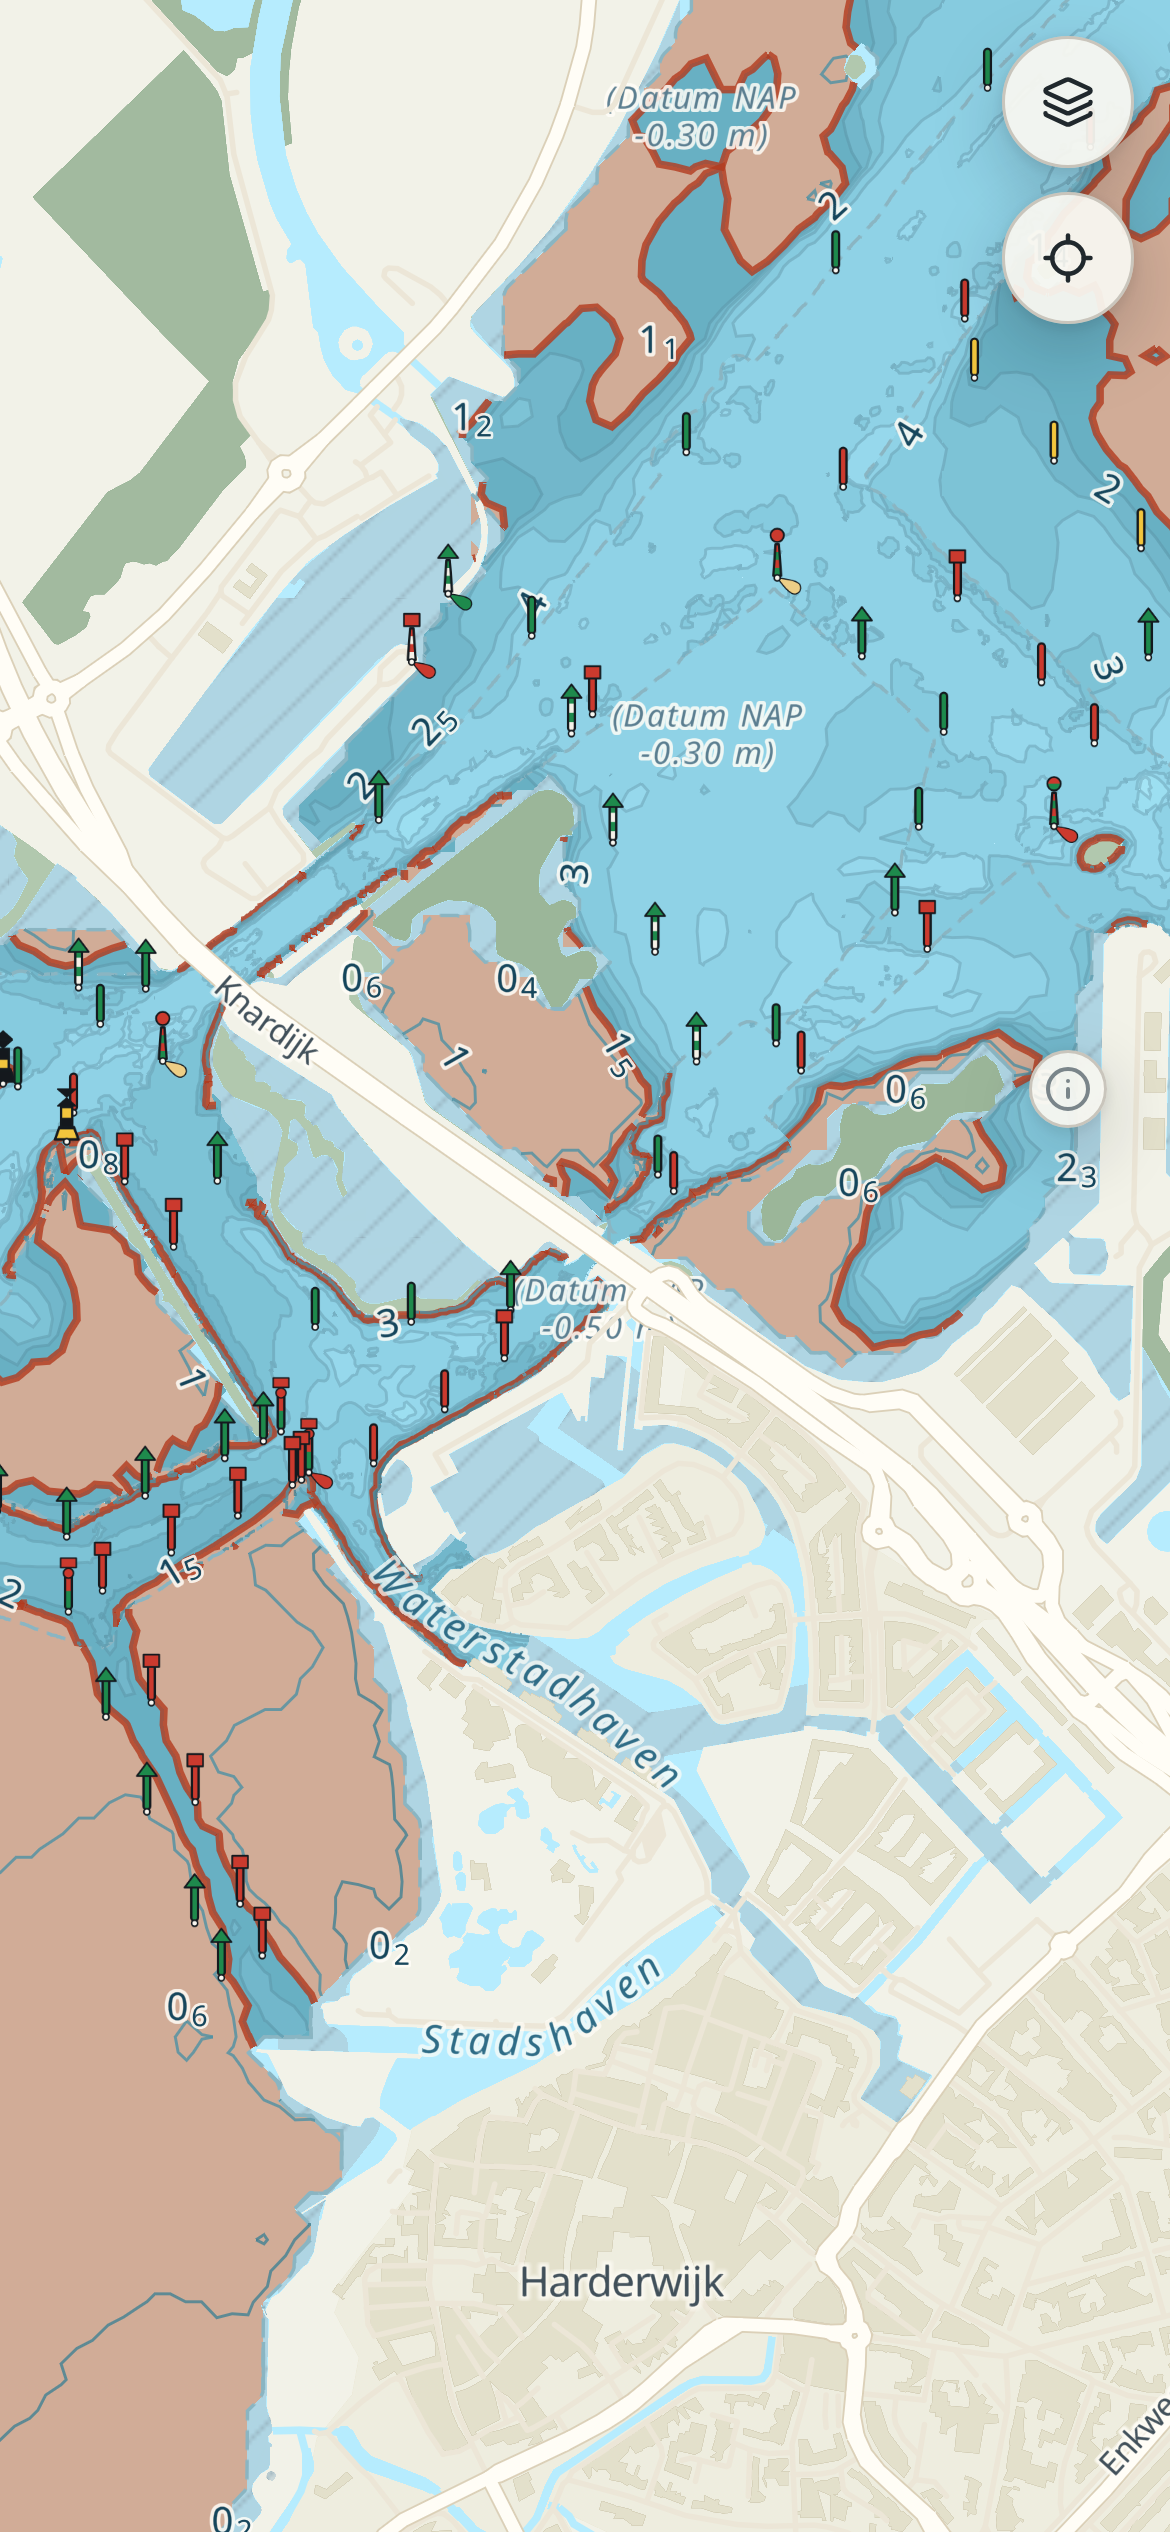
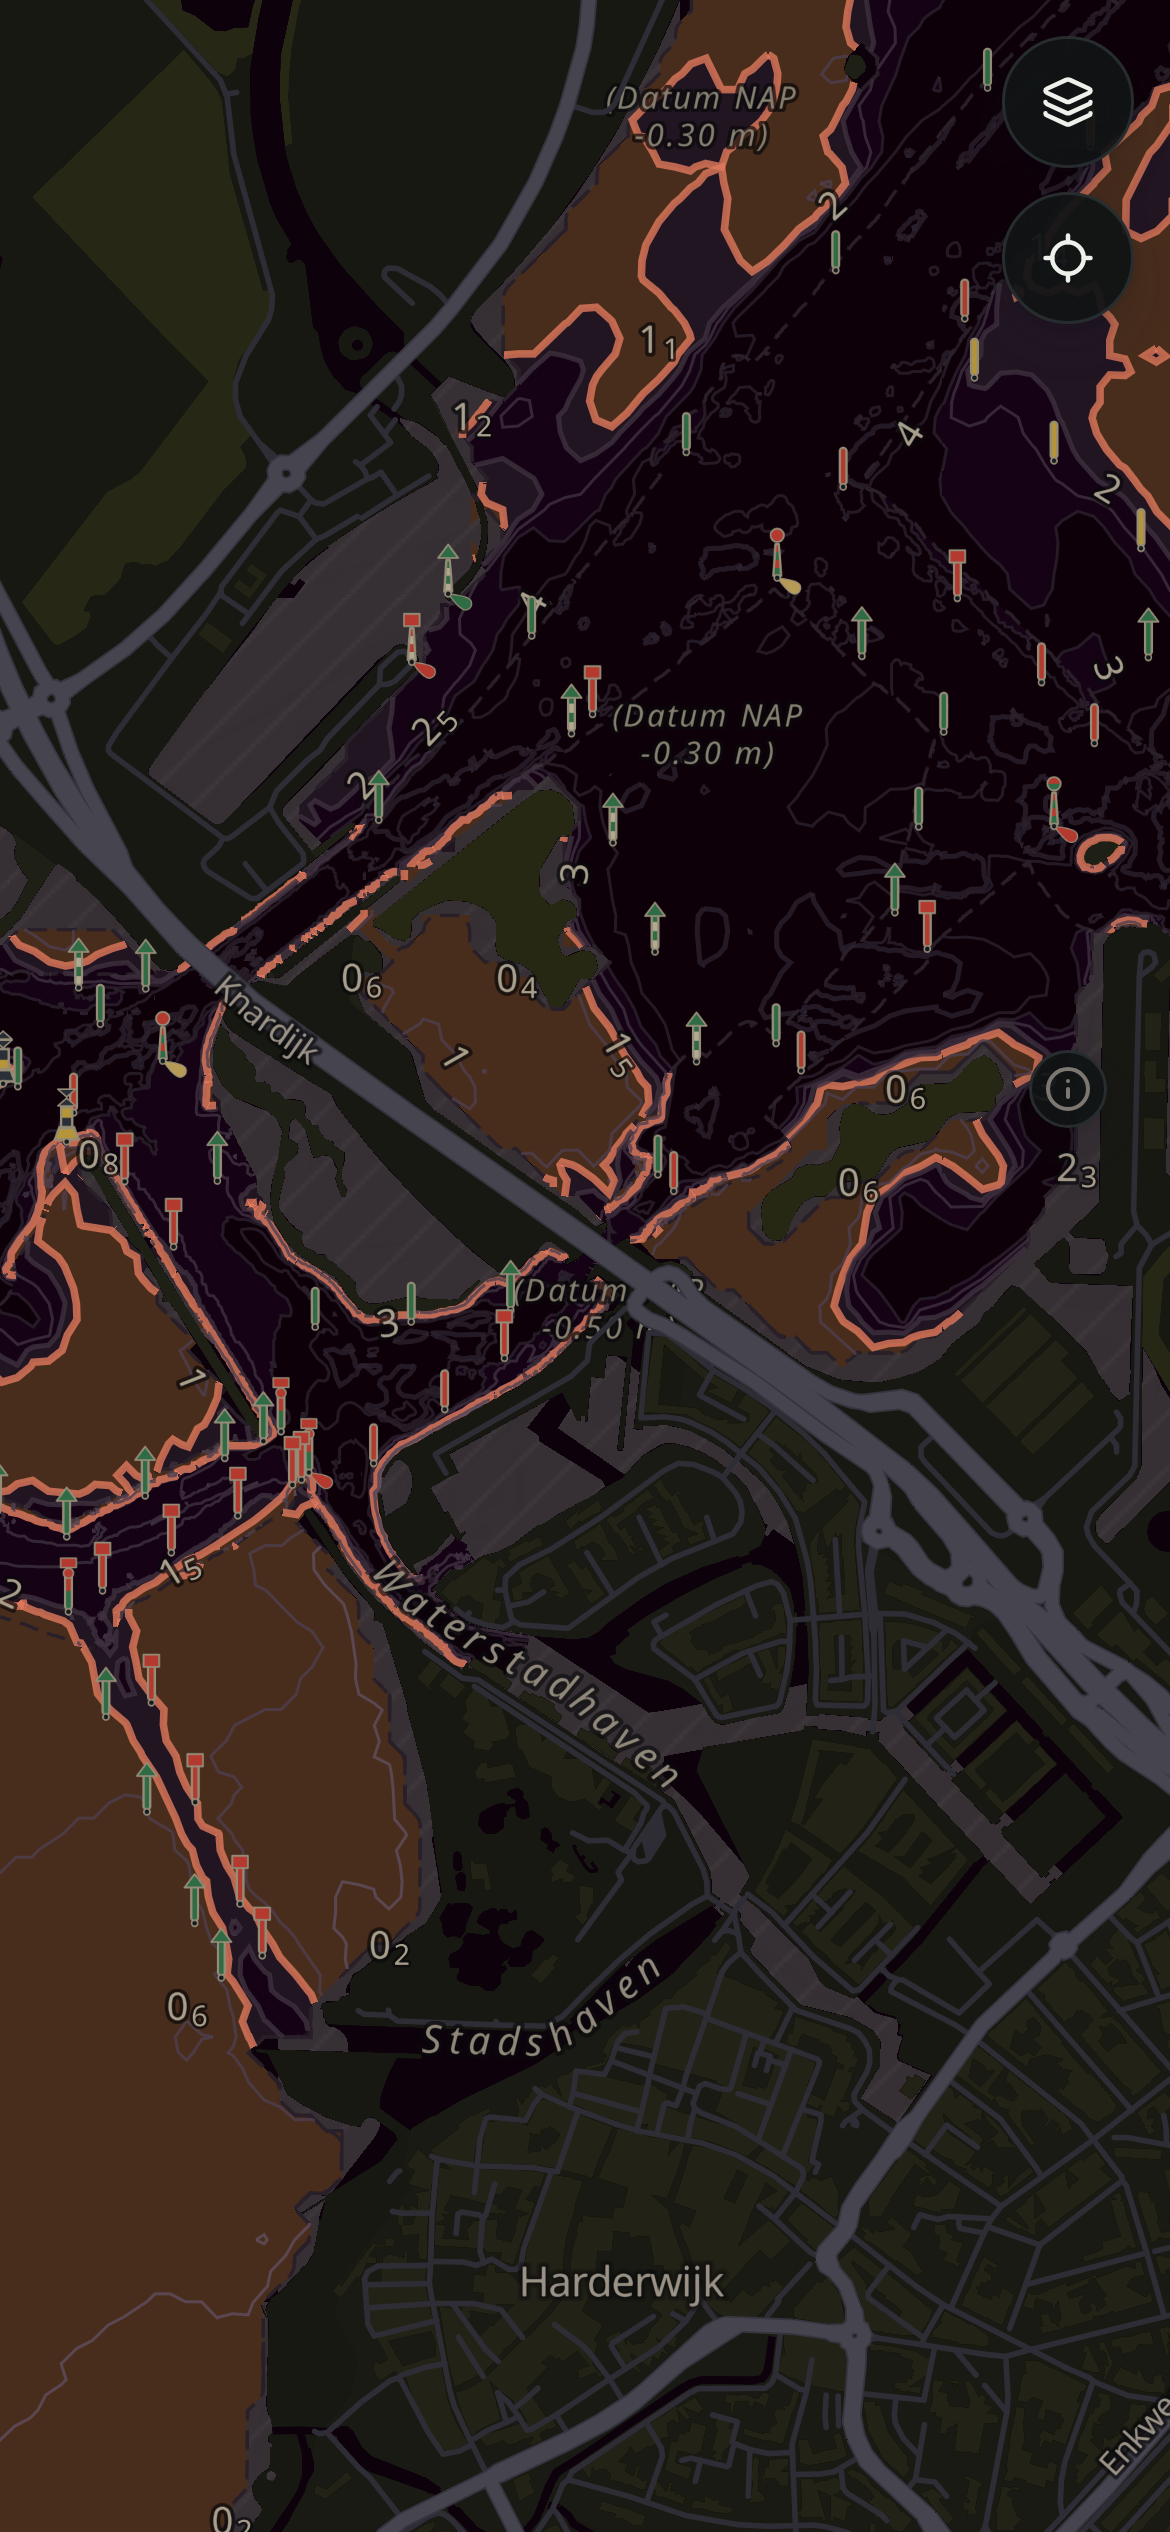
See where it gets shallow

Set your draught and the chart shades the water that is too shallow for you. The depths come from the official surveys, from the Wadden Sea to the Veluwe lakes.

Phone with the chart of the Veluwemeer near Harderwijk: the depths shaded for the set draught, the water that is too shallow marked.Phone with the chart of the Veluwemeer near Harderwijk: the depths shaded for the set draught, the water that is too shallow marked.Phone with the chart of the Veluwemeer near Harderwijk: the depths shaded for the set draught, the water that is too shallow marked.

Every light with its own character

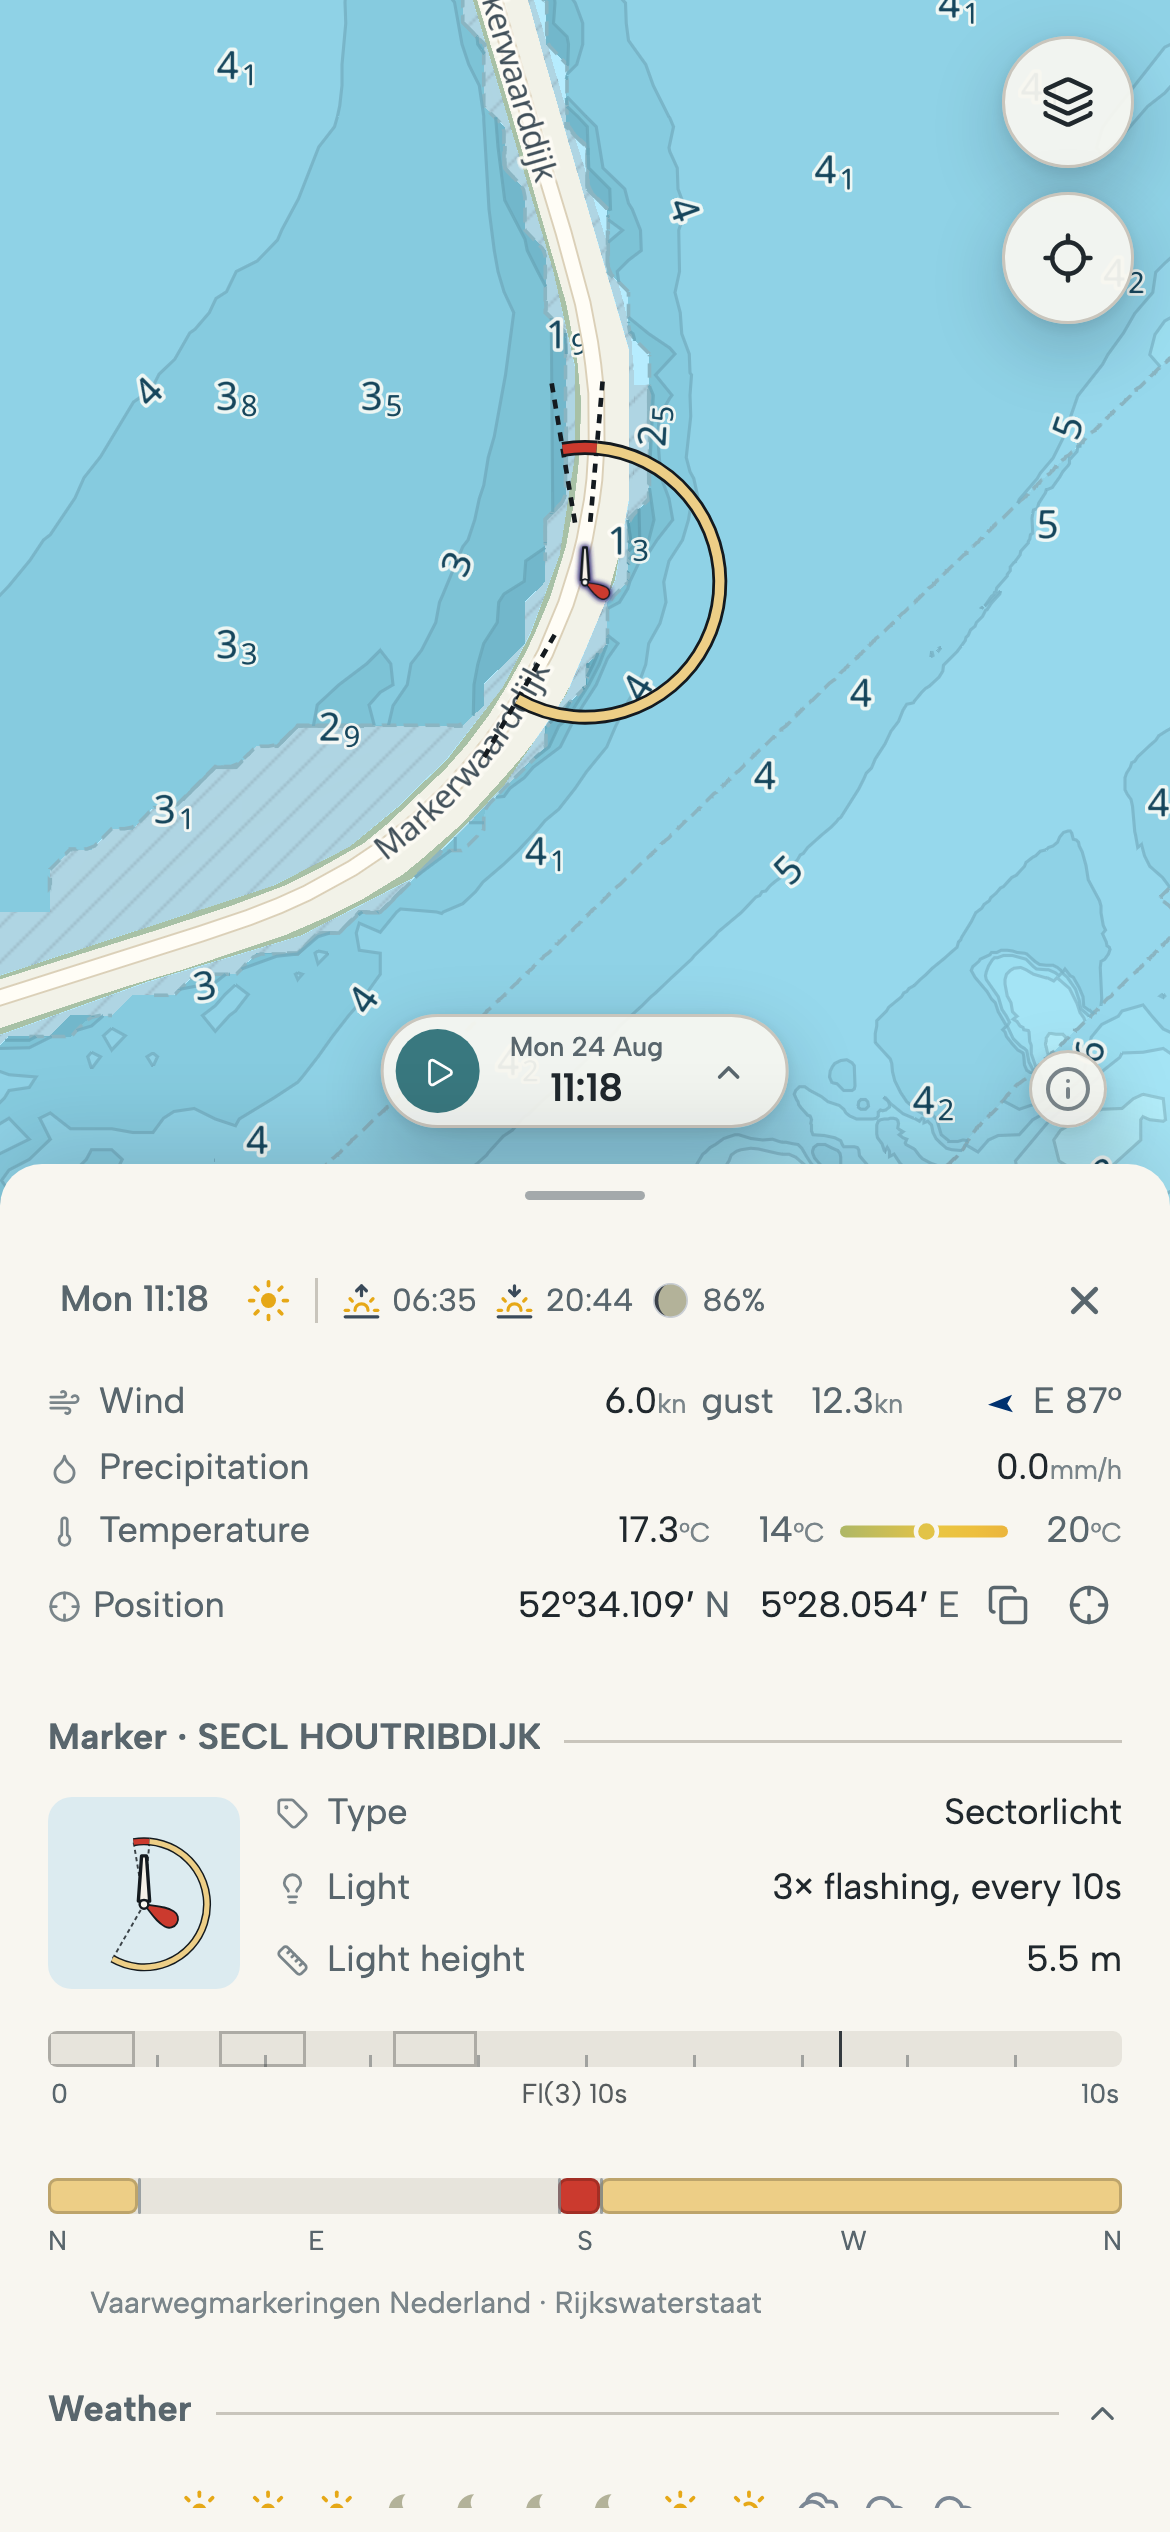
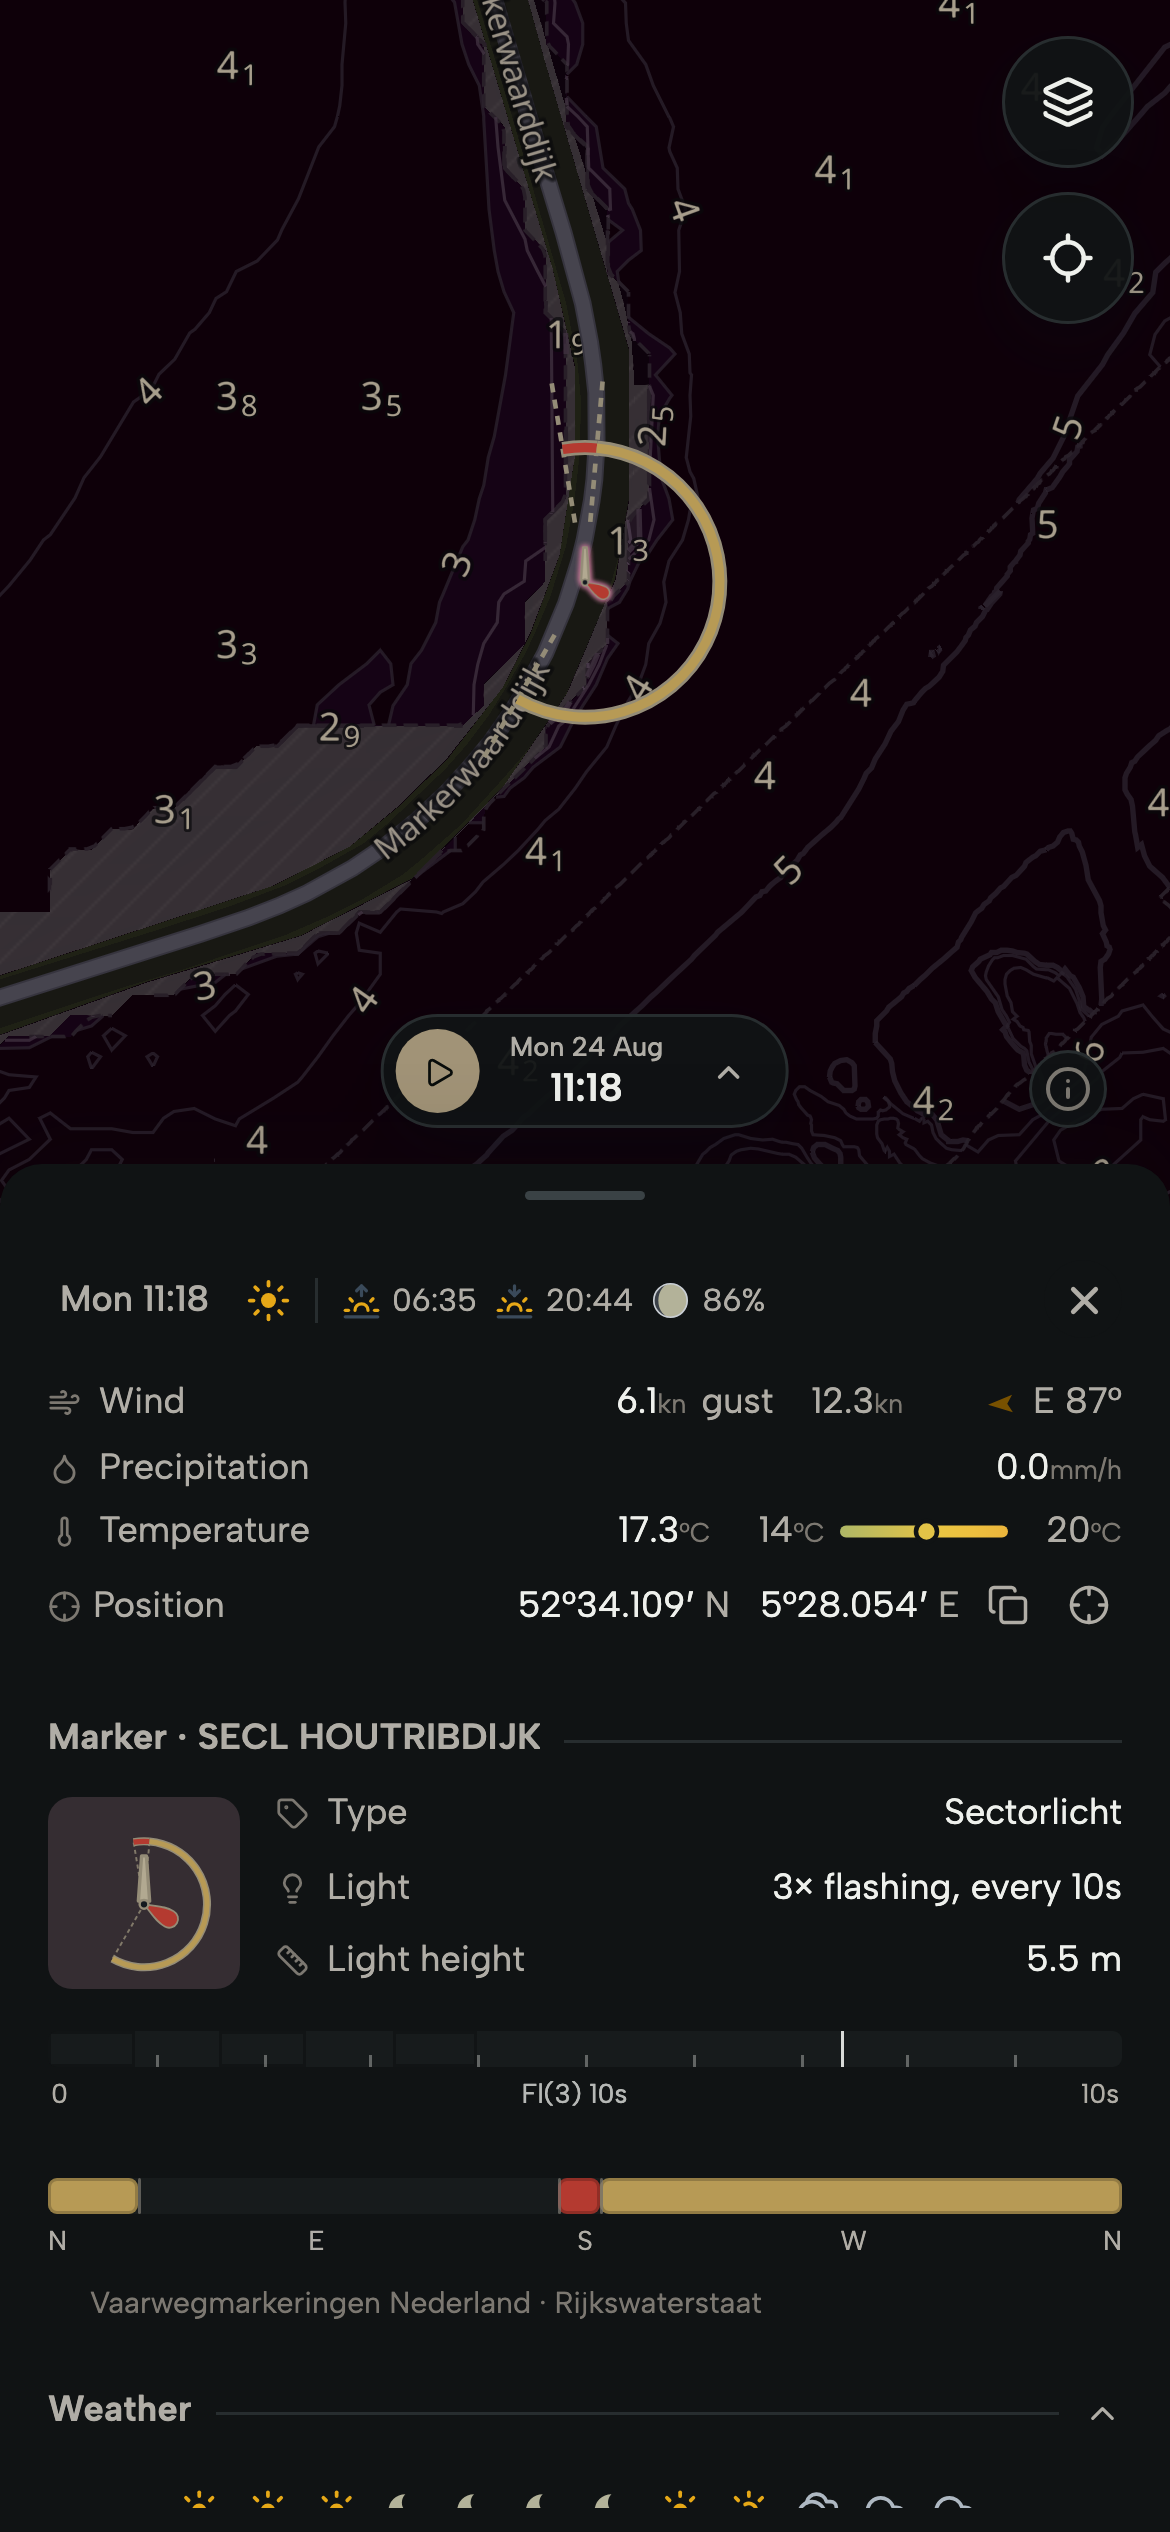
Pick a light on the chart to see its rhythm and sectors. That is how you recognise it on the water at night.

Phone with the sector light on the Houtribdijk selected: its character, sectors and rhythm in the information panel.Phone with the sector light on the Houtribdijk selected: its character, sectors and rhythm in the information panel.Phone with the sector light on the Houtribdijk selected: its character, sectors and rhythm in the information panel.

Watch the current flow

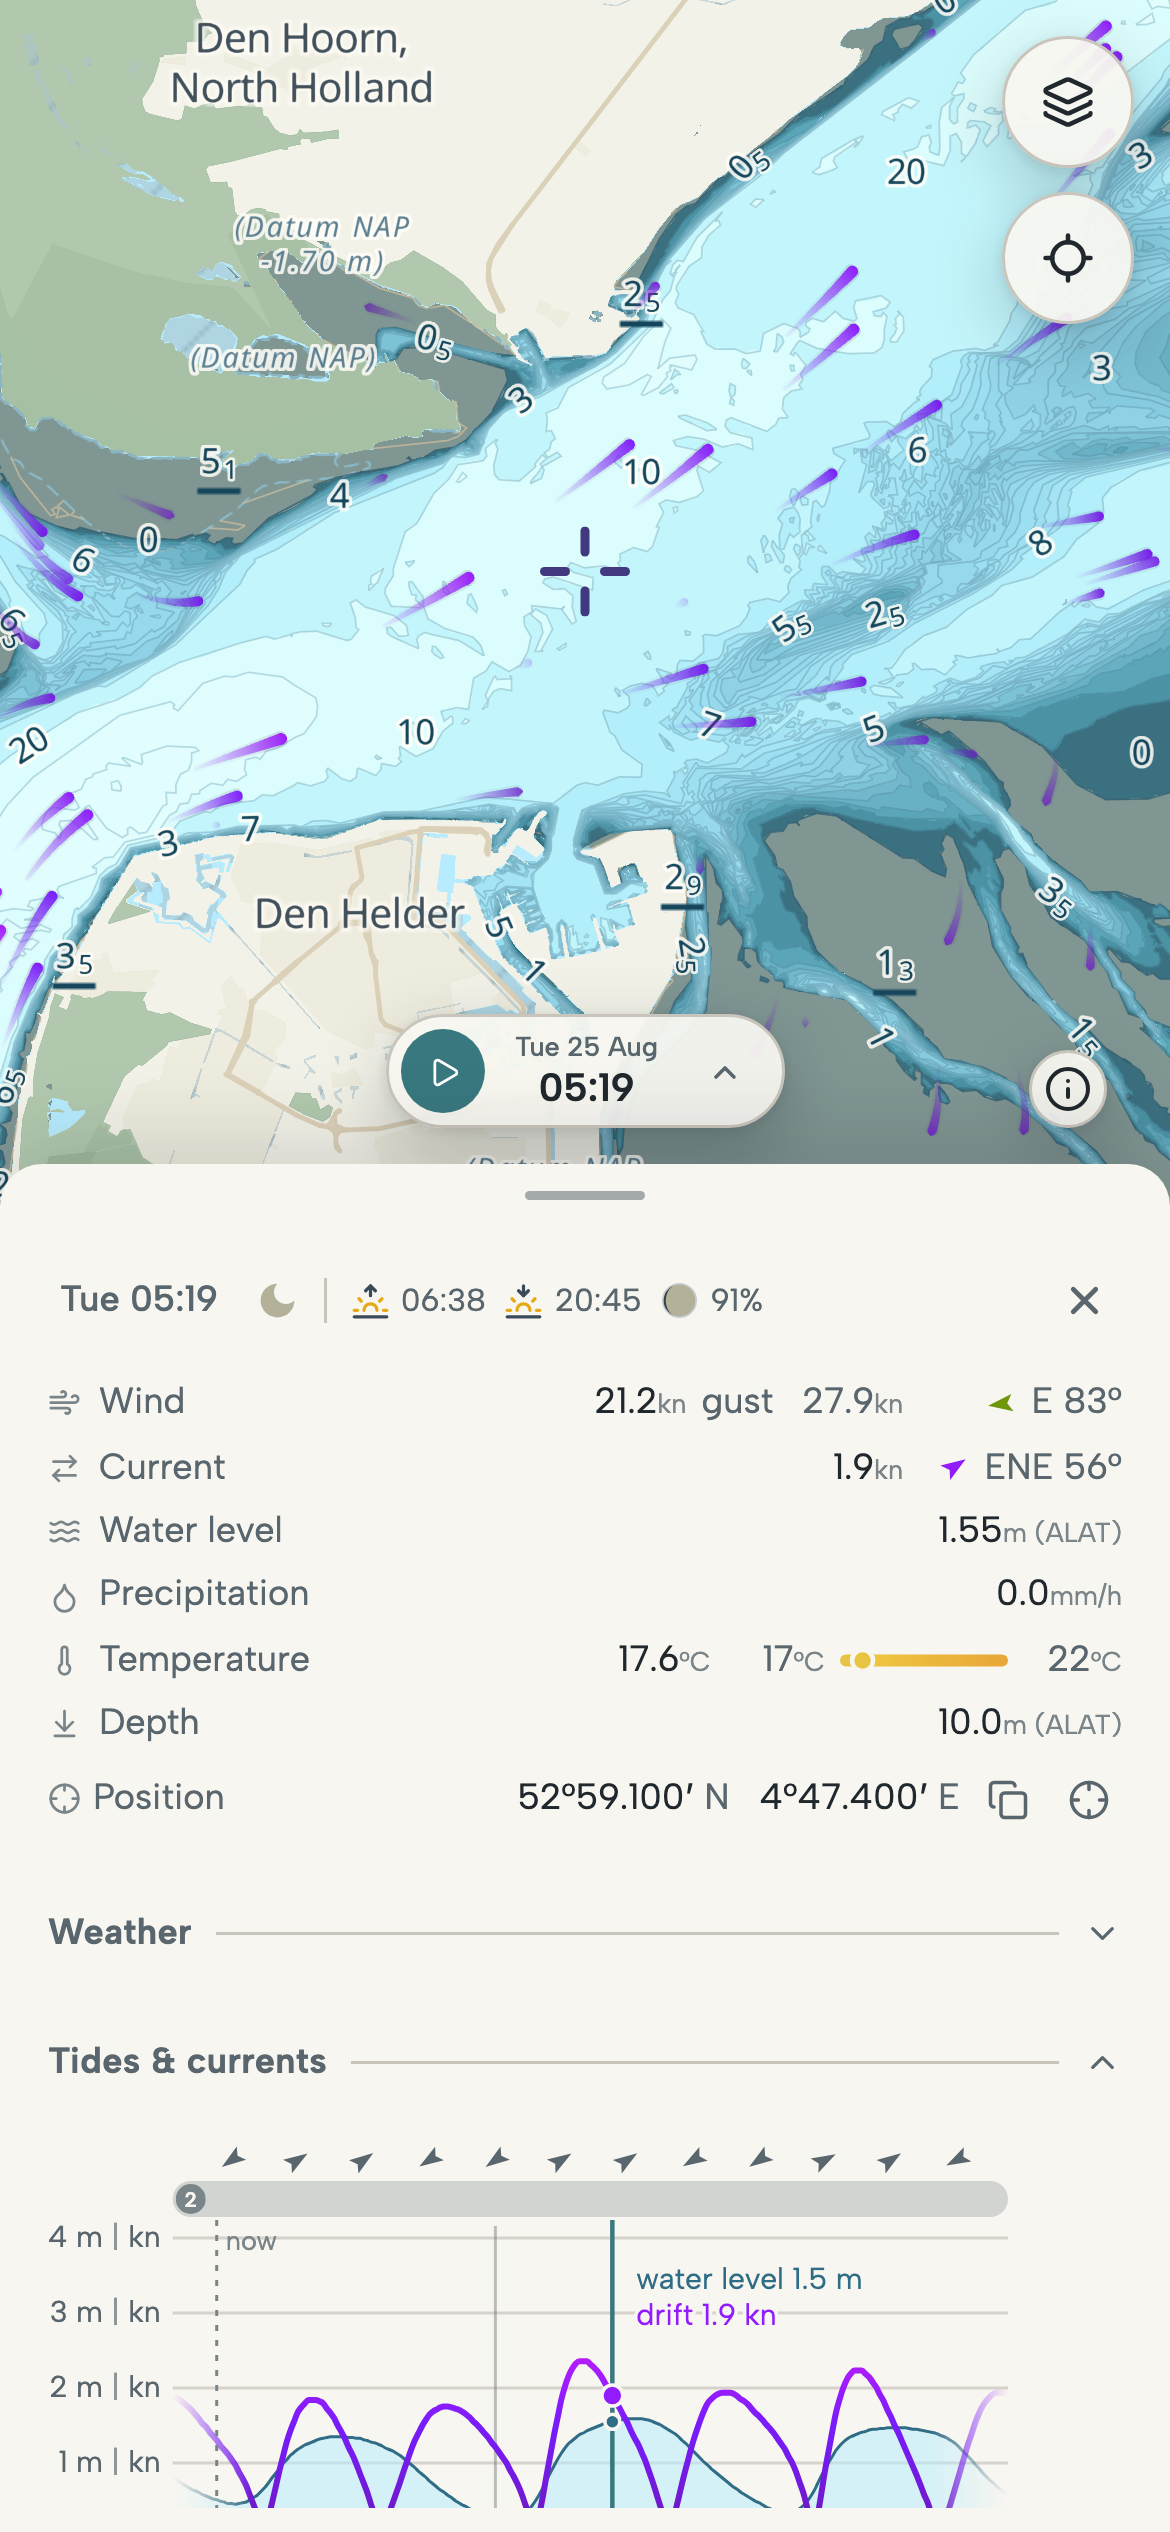
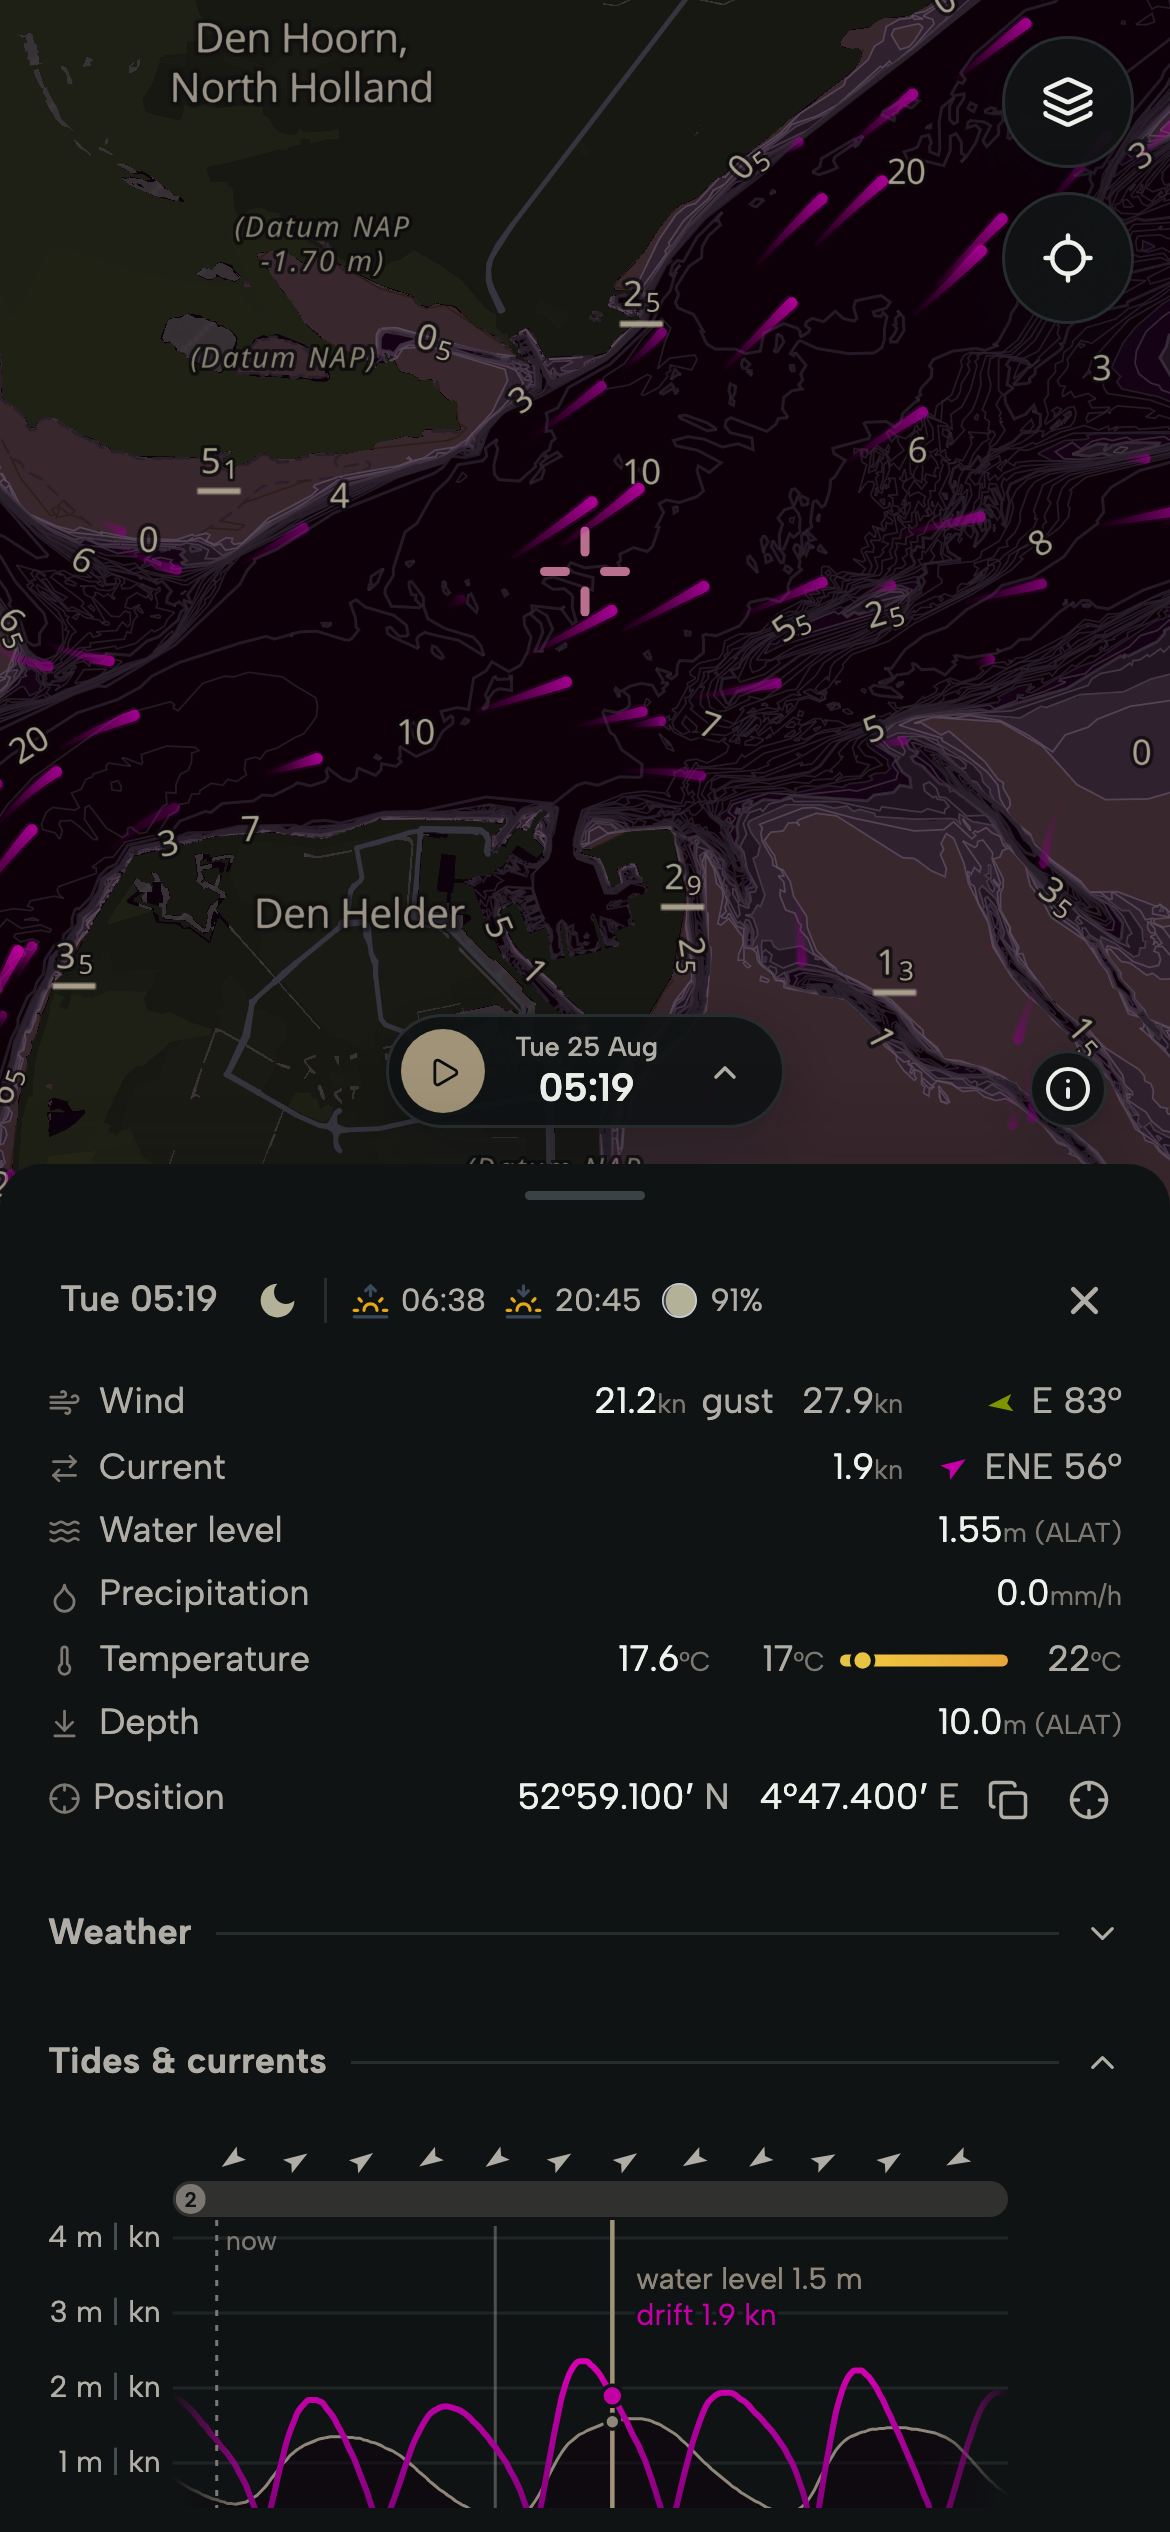
The sea flows across your chart at full strength. Pick a point and see when the tide will be with you, days ahead.

Phone with the tidal current through the Marsdiep between Den Helder and Texel over the depth chart, and the current graph for a chosen point.Phone with the tidal current through the Marsdiep between Den Helder and Texel over the depth chart, and the current graph for a chosen point.Phone with the tidal current through the Marsdiep between Den Helder and Texel over the depth chart, and the current graph for a chosen point.

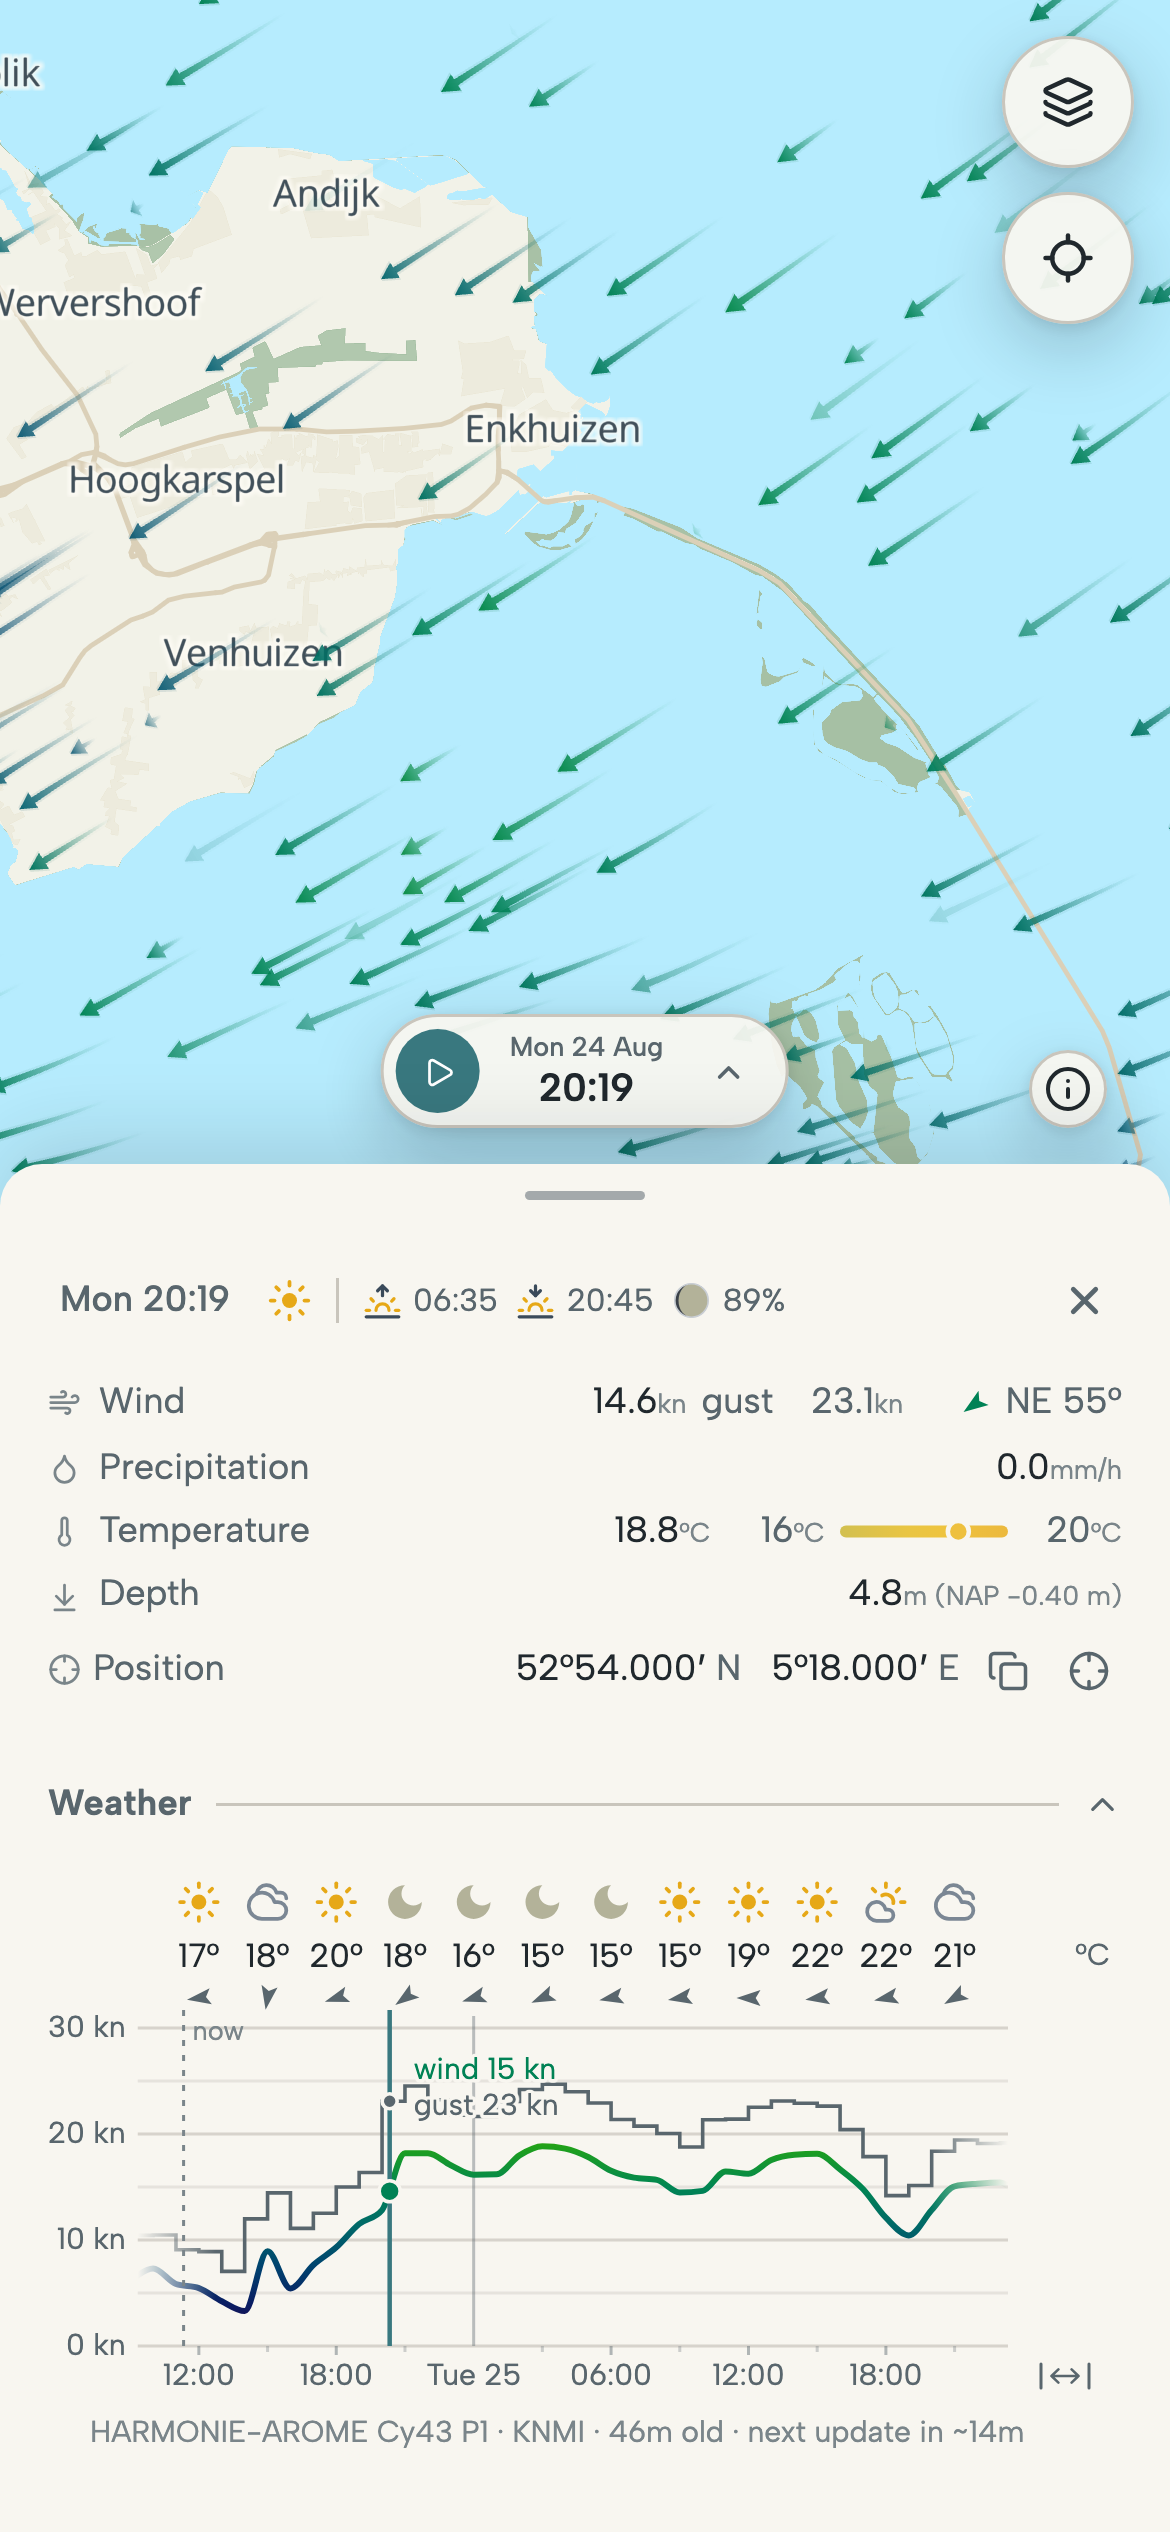
Wind and weather, hour by hour

In the Netherlands we use KNMI HARMONIE-AROME data, elsewhere the best regional model. Wind, gusts, temperature and rain hour by hour, so you know what's coming.

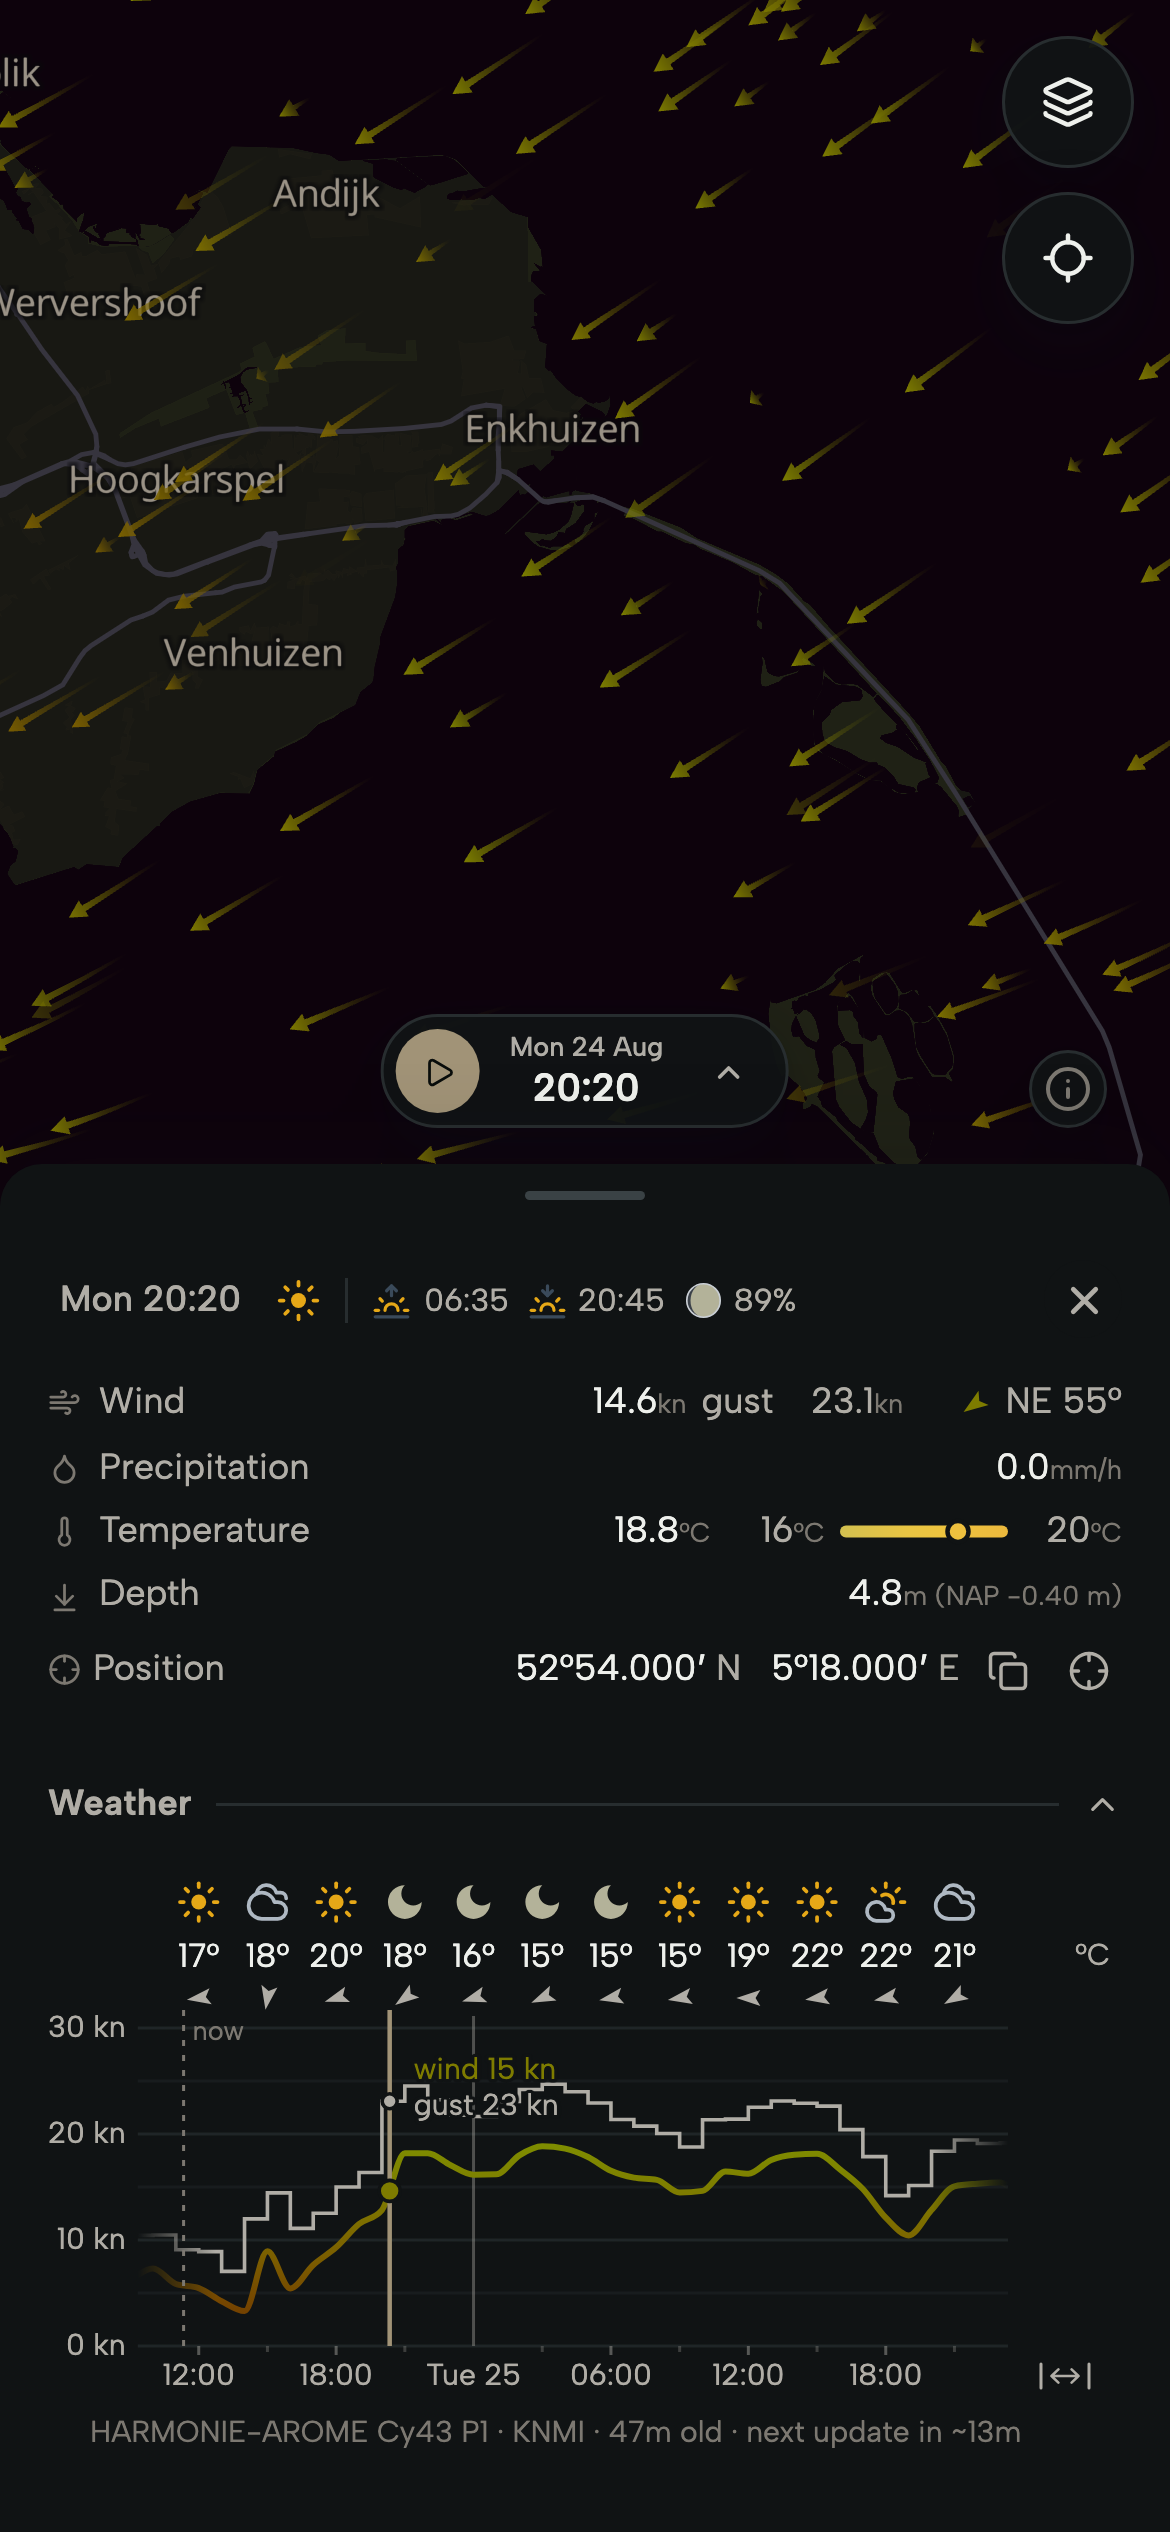
Phone with the wind over the IJsselmeer and the weather graph for a chosen point: wind, gusts, temperature and rain by the hour.Phone with the wind over the IJsselmeer and the weather graph for a chosen point: wind, gusts, temperature and rain by the hour.Phone with the wind over the IJsselmeer and the weather graph for a chosen point: wind, gusts, temperature and rain by the hour.

Set sail.

Invite-only for now, open to everyone soon. Leave your email address and we'll send you an invitation as soon as there is room.

Thank you.

We'll email you as soon as there is room.
Open the map